Methodological challenges prompt reassessment of Florida consumer sentiment trends
Our report on Florida consumer sentiment for this month focuses on a retrospective review of methodological issues that may have affected our measurement of consumer sentiment since April 2025. In this release we describe increasing challenges to survey research nationally, how the UF Survey Research Center has responded to those challenges, and how the changes may have impacted the consumer sentiment index for Florida.
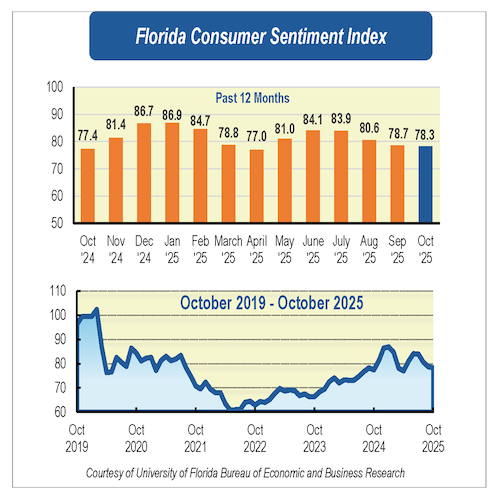
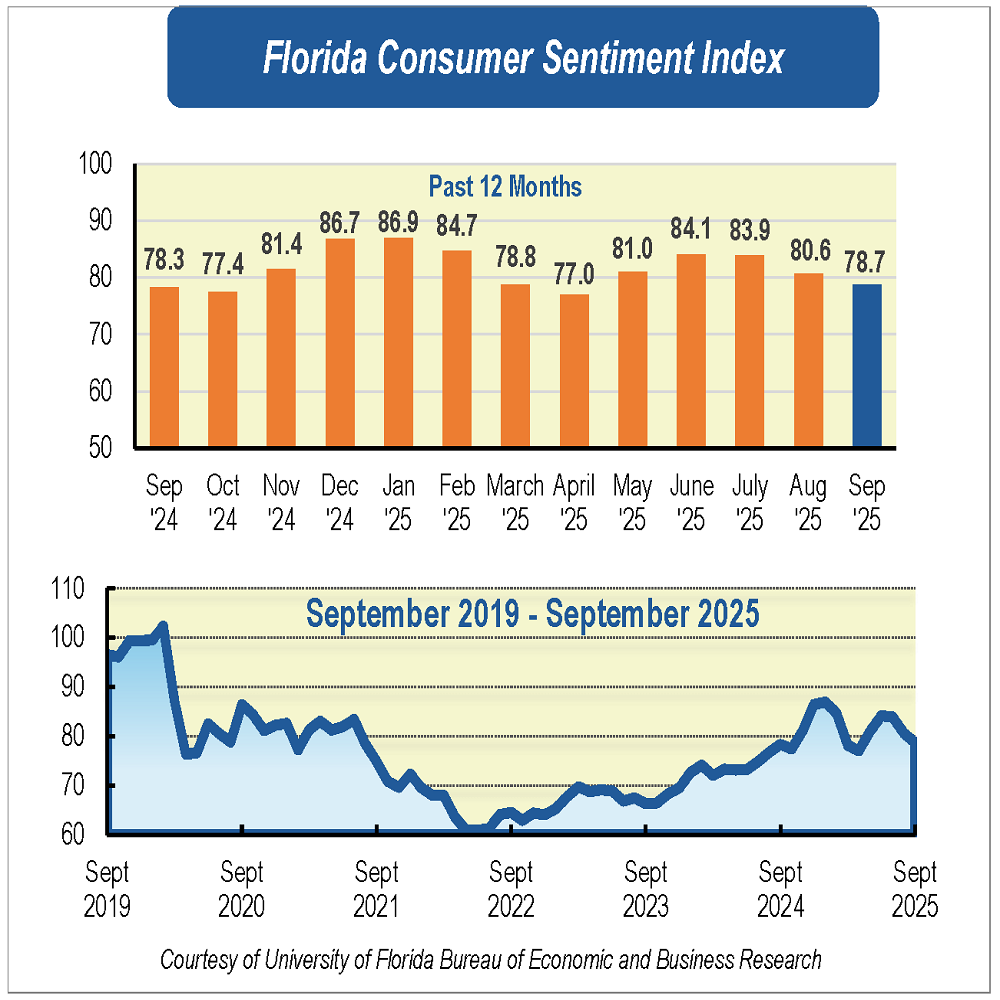
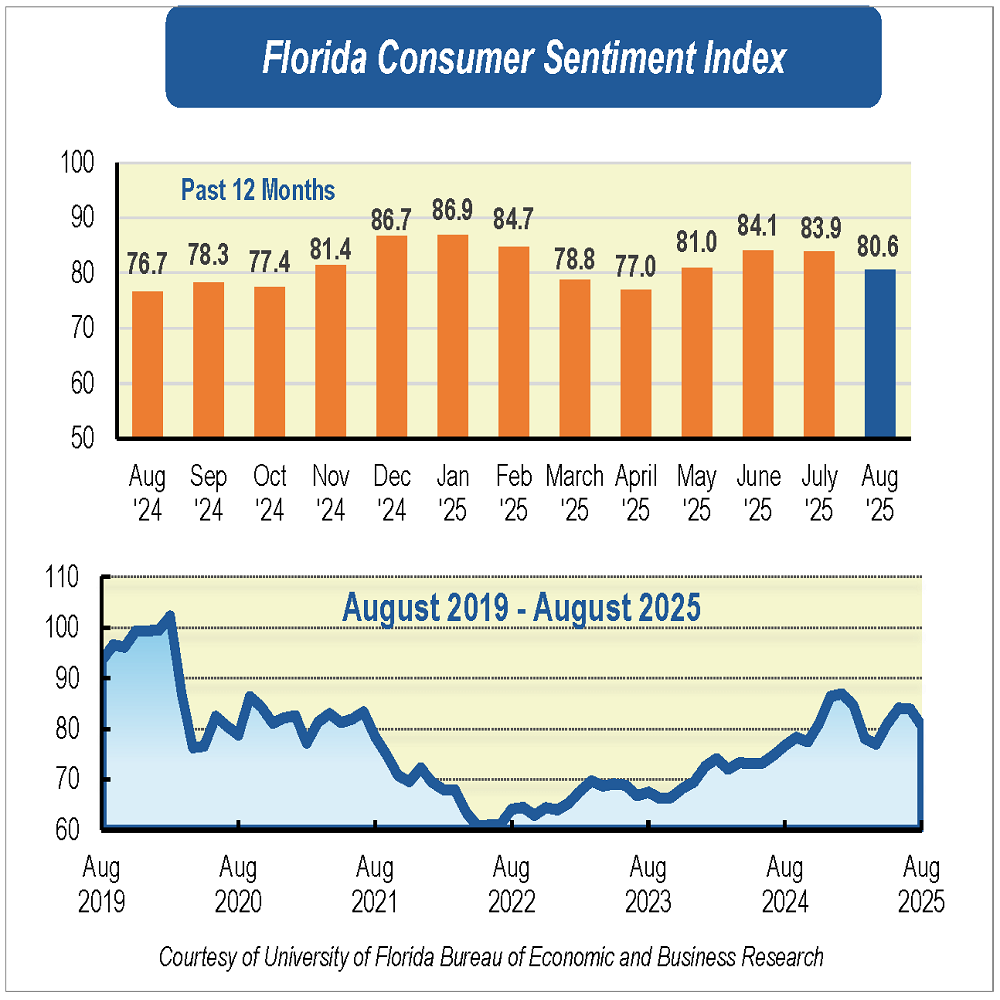
For November, the overall index is 76.9. The University of Michigan index for the U.S., which also includes Florida, came in at 51. As shown in Figure 1, our index for Florida has on average been higher than the national index from the University of Michigan in most months for the past few years. Our initial assessment was that Florida’s consumer sentiment reflected higher optimism than the U.S. due to the robustness of the Florida economy relative to the national economy, and characteristics of its residents that made such increased optimism plausible. However, given our other recent surveys, we are now questioning some methodological changes we implemented in 2020. This issue does not affect telephone surveys conducted using listed samples provided by clients, such as health evaluation surveys conducted for various organizations.
For context, the survey research environment both nationally and globally has become more challenging over the past 20 years. Our survey lab has been operating since 1985, and for most of that time we relied heavily on telephone surveys based on landline telephones to conduct our monthly consumer sentiment and other general population surveys. Landline phones attached to walls within households provided many advantages, including the ability to accurately predict household characteristics linked to a telephone number and to achieve a level of productivity that made telephone surveys the primary method of data collection for decades.
Our monthly survey, like the University of Michigan’s, was based on Random Digit Dialing (RDD), where telephone numbers were created at random with knowledge about which area codes, three-digit prefixes, and even parts of the four-digit suffix were being called. This approach made it possible to recruit 500 completed interviews each month that were representative of the state of Florida at a reasonable cost.
Beginning in 2005, individuals began adopting cell phones at a rapid pace. By 2010, more than 80% of households were cell-phone-only or cell-phone-and-landline. In 2015, the UF Survey Research Center abandoned all landline phones and moved to cell-phone-only surveys. Similarly, the University of Michigan made the change to cell-phone-only in 2015. This approach worked well for about five years, but increasingly cell phone providers provided more services to filter out unwanted calls. Even though our surveys were for research only and not for marketing, our calls were filtered out by many cell phones. This meant that the cost of getting a completed interview via a cell phone increased dramatically.
In 2020, the UF Survey Research Center made an additional adjustment. We reduced the number of cell phone completes to 250 per month and added a set of online panel completes offered by a commercial vendor. Meanwhile, in 2024, the University of Michigan abandoned its cell phone methodology in favor of an online panel recruited from address-based sampling (ABS). The differences between these panel strategies are crucial
Telephone surveys involve an interviewer contacting a potential respondent by phone. After the respondent consents to the interview, the interviewer reads each question and records the answer on the interviewer’s computer. There is little opportunity or incentive for a respondent to fabricate answers, as the interview would take about the same amount of time to complete. With online surveys, the respondent reads the questions and answers them on their own. Online panels that pay an incentive motivated some respondents to get through the interview quickly to receive the incentive. The University of Michigan mails prospective respondents a letter inviting them to participate. Respondents to their survey are not paid; therefore, they have little reason to rush through the survey.
After a recent review, we determined that some of the responses from our paid panel respondents result in significantly higher measures of consumer sentiment than our telephone respondents in Florida and the University of Michigan respondents nationally, as shown from Figure 2. For November, the overall Florida index is 76.9; considering the telephone survey only, the index is 72.5, and the online panel only is 81.8. This could result from online respondents in our paid panel rushing through the responses to the five questions, where the number 1 always signifies a positive response. As we cannot identify systematically which panel responses are fraudulent, we have decided not to use this approach in the future. We advise those using the University of Florida consumer sentiment series to rely on the telephone responses only. Future releases will be based on a larger telephone survey sample only.


Conducted Oct. 1 to Nov. 25, the UF study reflects the responses of 303 individuals who were reached on cellphones and 265 individuals reached through an online panel, a total of 568 individuals, representing a demographic cross section of Florida.
Data are weighted based on Florida county of residence, age group, and sex to ensure representativeness of the Florida population. The population figures used for weighting are obtained from the Population Program of the Bureau of Economic and Business Research (BEBR), which produces the official population estimates for the state of Florida. Phone data quality is maintained by monitoring and reviewing interviews and prevention of duplicate records. Online data quality is maintained by enabling and reviewing Bot and Fraud detection, elimination of “short time” completes, and preventing the survey from appearing in web search results.
The index used by UF researchers is benchmarked to 1966, which means a value of 100 represents the same level of confidence for that year. The lowest index possible is 2, and the highest is 150.
Details of this month’s survey can be found at bebr.ufl.edu/florida-consumer-sentiment/.