FAWN expands weather stations to some Florida state parks

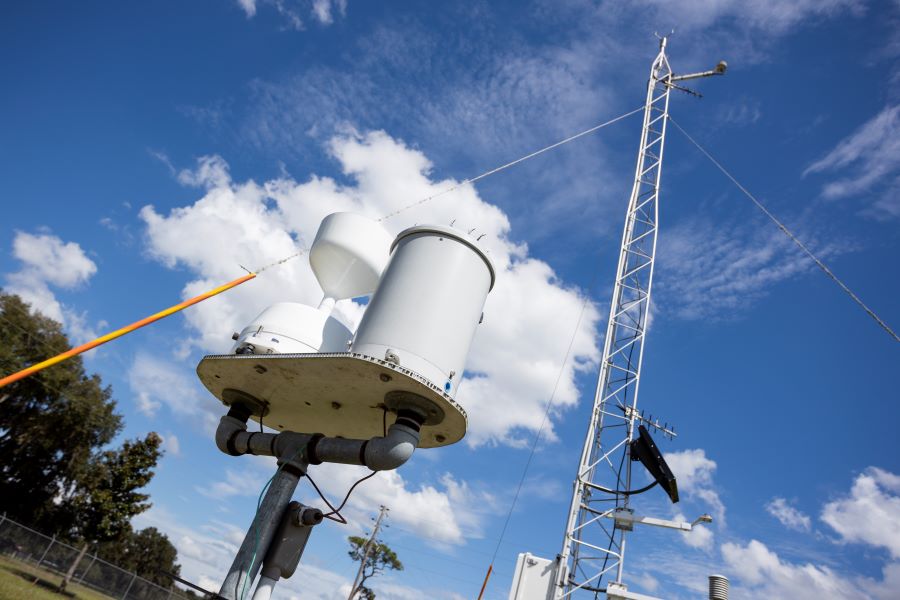
A FAWN weather stations. Courtesy, UF/IFAS photography.
Working with The Nature Conservancy, the UF/IFAS Florida Automated Weather Network (FAWN) is adding stations in Bristol, Poinciana, Babson Park and Jupiter to help park rangers assess wildfire risks.
This marks the latest update to FAWN, which, for nearly 25 years, has provided temperatures, humidity and wind speeds – among other meteorological data – to Florida producers.
FAWN stations can come in handy for farmers and nurseries this time of year, as we approach chillier weather in Florida. As the weather gets cooler, many of the state’s farmers rely on FAWN for accurate meteorological data to help them grow their crops.
We asked Rick Lusher, director of FAWN, about the history of the network, how the technology helps growers and about the new stations in the parks.
Q: Why was FAWN developed?
A: Prior to 1996, the National Weather Service (NWS) provided ag-specific forecasts using temperature data from weather stations located in rural/agricultural areas. For budgetary reasons, the NWS discontinued this service in 1996 and began using only data from their official reporting sites (which are all at airports) for their forecasts. This negatively impacted the forecast accuracy in rural areas in Florida, partly because there were fewer stations, but also because there can be substantial differences in temperature between more urban areas (airports) and agricultural/rural areas. After freezing temperatures hit much of Florida the next year and caused significant crop damage, UF/IFAS and several partner agencies petitioned the state to establish a network of weather stations that would be primarily located in rural areas. FAWN started with 11 stations that were part of an existing Extension network, mostly in Orange and Lake counties, and now we have 47 stations statewide.
Q: How has FAWN evolved over the years and why?
A: When we started, we mostly had stations in areas that grew citrus. Because we’ve grown in the number of stations, we can provide data and tools for more crops, including blueberries, strawberries and a half-dozen varieties of vegetables.
Q: What do farmers do with the data you provide?
A: They use our recommended irrigation schedules for citrus, blueberries, strawberries and five or six types of vegetables. That way, they don’t use too much or too little water. They use our Cold Protection Toolkit in the winter to determine the best times during which to apply water to their crops for freeze protection. They also use our data to do their own research and to supplement local measurements.
Q: When are the most frequent times/conditions that growers use FAWN?
A: If cold weather is approaching – we’re talking upper 20s to mid-30s in the forecast – farmers turn to FAWN. The network’s stations tell farmers temperature trends, humidity, wind speeds and more that will let them know whether and how long to run their water. November through March is prime time for us. We get the most interest from growers during the cold season. They want to know if they need to water their fields to prevent cold damage.
Q: What areas of Florida use the FAWN stations the most?
A: From north of Gainesville west to Live Oak and down to as far south as just north of Lake Okeechobee is probably the geographical area in which we see the most use, primarily because this is where many crops are located that require some type of freeze protection during the winter. We know this because we look at web statistics to see how many are using the FAWN website, which pages and tools producers are using, and which specific stations they are using.
Q: What are some other ways Floridians can use FAWN?
A: Our mission is to provide data and tools for as wide a variety of users as possible. That means lots of people use our data: scientists, water management district officials, National Weather Service meteorologists, farmers, the Florida Division of Forestry and more. Researchers use it to collect data. We also provide temperature, rainfall, and more data for places where the National Weather Service doesn’t have stations – in rural areas, primarily. Some growers download our data and use it, but the typical farmer will look at measurements from the gauge closest to their farms. We give rainfall and evapotranspiration information to give farmers a recommended irrigation schedule. Our most-visited data is our graphic weather page.
Q: What kind of improvements has FAWN made over the years?
A: We’re installing soil-moisture sensors at each of our existing 47 stations. Readings from the soil moisture sensors tell the user how wet or dry the soil is. Although farmers can use this to determine water needs, our new project is geared more toward flood and drought mitigation in an emergency management context. This project will help farmers mitigate damage from drought and floods.
Also, in partnership with The Nature Conservancy, we’re installing stations with sensors at Apalachicola Bluffs and Ravines Park (Liberty County), Tiger Creek Preserve (Polk), Disney Wilderness Preserve (Osceola) and Blowing Rocks Preserve (Palm Beach) to help park rangers assess wildfire risks. Specifically, we are measuring soil moisture and also fuel temperature and moisture, which will give them the moisture level and temperature of the surface vegetation, such as grass, etc.
